Project Overview
The picture below shows a room commonly known as the "Grad Lab" within the Music Engineering students at the University of Miami. As you can see, there's not much use for it at the moment, hence the mess. The school administration has been talking for years about converting this room into something more useful, the most popular idea being a listening room that students can use for mixing. Unfortunately, the room doesn't sound great as it is.

For our final project for Acoustics (MMI606), we were tasked to provide an acoustic analysis of the room and propose a potential treatment based on our findings, as the first step to re-purposing this room for future Music Engineering students to utilize. The project involved four major components:
-
Calculations: modal analysis, bolt's area, Schroeder frequency, etc.
-
Room Measurements: using Room EQ Wizard software, find info regarding SPL, RT60, etc.
-
Proposals: Ideal speaker and listener placement, and a room treatment based on analysis
As a class, we took 30 room measurements total using a QSC K12.2 loudspeaker to play a sine-sweep, which is known to have a relatively flat frequency response above 50Hz. An Earthworks QTC50 omnidirectional microphone was used to pick up the room response, which also has a considerably flat frequency response. The microphone was placed in 5 different locations in the room; 3 measurements were taken with the microphone pointed in a certain direction at a given location, and another 3 pointed in a different direction at the same location. This meant there were 6 measurements per location.
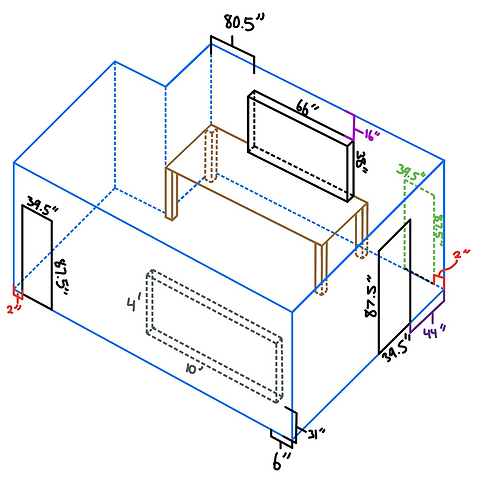
Room Dimensions
The picture shows the measured dimensions of the room, not drawn to scale. Most importantly, you can see that there is an indent in the furthest corner of the room. For some of our calculations, the project specifications state to disregard the corner indent for the calculation portion of the project, and instead consider the room as a rectangular parallelepiped. This will simplify things greatly.
Let's start by determining if this room fits within the Bolt's Area criterion, which tell us whether the dimensions of the room are ideal for listening conditions. To do this, we will consider the room as a rectangular parallelepiped and disregard the corner indent, as stated before, meaning we will be using the longest length and width measurements.
Length: 24 ft, 4 in
Width: 9 ft, 10 in
Height: 8 ft, 7 in
Using these values, we can find the ratio of these measurements, with the height normalized to 1. This results in the following:
2.835 : 1.146 : 1.000 (length, width, height)
The criterion states that a room is within Bolt's Area if the ratio of its dimensions fits within the dotted area shown in the figure. Unfortunately, one can clearly see that our ratio does not fit within Bolt's Area. The closest is point G, at
2.5 : 1.5 : 1, known as the Volkmann ratio.

Drawing by Nicolas Adler, an MMI606 classmate.
Figure not drawn to scale.

Figure taken from class notes.
Schroeder Frequency Calculation
The calculation of the Schroeder Frequency is crucial for acoustic analysis of a room; it determines the theoretical point in which room modes become dense enough to no longer be considered. Above the cutoff, issues can simply be treated with absorbers and diffusers, rather than be treated as modes. The Schroeder Frequency is calculated by the following equation:
fc = 11885 * sqrt(RT60 / V)

From class notes.
where V is the volume of the room in cubic feet. This can be easily calculated with the dimensions above, which results in a volume of 2053.8 cubic feet. The value of RT60 for this equation can be taken from our measurements from Room EQ Wizard, and the project specification asks to use the RT60 at 500Hz for this calculation. When taking the average of all 30 measurements, we can calculate an RT60 value of 354.6 milliseconds.
Then, we can simply plug in these values into our equation to find the Schroder Frequency to be 156.17Hz. This will be useful when we do our modal analysis.
Modal Analysis: Modal Density and Spacing
A full list of modes including axial, tangential, and oblique modes of the rectangular parallelepiped can be quickly found by using the website amcoustics.com, given the room dimensions. In this case, axial modes (ax) are defined by the modes between one set of parallel surfaces, which will theoretically be the most prominent and concerning. tangential modes (tan) are between two sets of parallel surfaces, and oblique modes (obl) are between all three, which will be the least prominent.
When taking a look at at the list provided by Amcoustics, you can see there are 42 modes up until the Schroeder Frequency, 156.17Hz.
The notation "1-0-0" represents the mode order with length-width-height. So for example, mode 1-0-0 would be the first-order mode across the length of the room. Since it is only across one dimension, it is considered an axial mode.
Ideally, you do not want modes to be spaced too far apart, or too close together. Wide spaces will result in unwanted dips in the frequency response, whereas dense regions will result in unwanted peaks. At first


glance, we can take a look at the axial mode spacing to see where any issues may be, as axial modes will theoretically be the most prominent. The gap between modes #1 and #2 could be a potential issue, as they are spaced very far apart; however, the mode at 23.13Hz may be low enough to not even be considered as most speaker systems will not be able to properly reconstruct frequencies that low. Axial modes #19 and #20 are extremely close, which could be a big issue as well.

The picture above is another graphic provided by Amcoustics to better visualize the modal spacing. The longest lines represent axial modes, the shorter lines represent tangential, and the shortest represent oblique. Ideally, modal spacing should increase consistently as frequency increases; and the picture above shows this to be true, with the exception of the first mode.
Bonello's Criterion
Another method of analyzing modal density is using Bonello's Criterion. A room meets the criterion if the number of modes per 1/3 octave band increases or stays the same, which suggests that the room has an ideal modal spacing and density. 1/3 octave bands are most commonly used, but can be replaced with different sized bands. Project specifications state to start the lowest band at 32.5Hz, and continue until the Schroeder Frequency. The bandwidths are calculated as follows:
-
32.5Hz to 40.95Hz – 0 modes
-
40.95Hz to 51.59Hz – 1 mode
-
51.59Hz to 65Hz – 2 modes
-
65Hz to 81.89Hz – 5 modes
-
81.89Hz to 103.18Hz – 6 modes
-
103.18Hz to 130Hz – 9 modes
-
130Hz to 163.79Hz – 24 modes
As visualized in the graphic, the modal density and spacing meets Bonello's Criterion for this frequency range; however, we must not forget that there is a mode at 23.13Hz that is not being considered. If analyzed with a different range to include this mode, it will most likely not meet the criterion.

Graph created by me, using MatLab.
Modal Density Estimation
Modal density for a rectangular parallelepiped can also be estimated with the following equation:

From class notes
In our case, we can calculate 2053.8 cubic feet as our volume (V), 1065.08 feet squared as the surface area (S), and 171 feet as the lengths of all edges in the room (L) based on our room dimensions. From here, we can analyze the same 1/3 octave bands shown above and compare our results. This process can be expedited by using a simple MatLab script:
-
32.5Hz to 40.95Hz – 0.7703 modes
-
40.95Hz to 51.59Hz – 1.2538 modes
-
51.59Hz to 65Hz – 2.0930 modes
-
65Hz to 81.89Hz – 3.5744 modes
-
81.89Hz to 103.18Hz – 6.2447 modes
-
103.18Hz to 130Hz – 11.1253 modes
-
130Hz to 163.79Hz – 20.1843 modes
the values of freqLow and freqHigh in the MatLab script can easily be changed for the different frequency bands.

Simple MatLab script, written by me.
Do you think I used enough digits of Pi?
Now, we can overlay a line of best fit from these estimated values over our previous graph to compare the results. The blue dots represent our estimated values. Overall, you can see that the estimation is pretty consistent with our previous results!

Graph created by me, using MatLab.
Analysis of Measurements
Now that our calculations are done, we no longer have to consider the room as a rectangular parallelepiped. For this part of the project, we can include the corner indent that is present in the actual non-rectangular room.
We can start this process by taking a look at the list of modes for the real, non-rectangular room, which will theoretically be more consistent with our measured results. This list will differ a bit from the list of modes shown before, since we were simplifying the dimensions earlier.
This list was also created with amcoustics.com, using their feature "Amroc Pro" room mode calculator for non-rectangular rooms.
Let's compare this list to our measurements from Room EQ Wizard and see how they line up!


SPL Graphs at 4 Different Locations


Location 1

Location 3
Location 2

Location 4
As you can see, the measurements vary greatly depending on the location in the room; this is because changing location will also change whether you are physically close to a null or peak of a mode, which will change the measured frequency response.
To compare, let's go in order of the modes, up to our Schroeder Frequency.
-
Mode #1 at 23.13 Hz is too low for the loudspeaker to reconstruct, so it is not visible.
-
Mode #2 at 47.01 Hz can be seen clearly in graph 1.
-
Mode #3 at 57.27 Hz can be seen clearly in graph 2.
-
Modes #4-9 from 61.56-81.32 Hz can explain the peak seen in both graphs 1 and 2.
-
Modes #10-12 from 87.83-91.14 Hz could be explained by the peak shown in graph 4.
-
Modes #13-22 from 97.44-126.44 Hz unfortunately do not show up that prominently in any of these locations. However, there is a small peak at location 3 in this range.
-
Modes #23-40 from 132.27-157.75 Hz can be explained by the second major peak in graph 2
Overall, the list of modes matches the measurements pretty well.
Speaker and Listening Locations
In order to find the ideal locations for the speakers and listener, we need to avoid the nulls of the room modes as much as possible. For this project, we will only consider the first and second order axial modes for each of the 3 dimensions of the rectangular parallelepiped, which is visualized with the drawing shown. These 6 modes will be the most prominent and have the biggest effect.
The solid lines represent the first order modes, and the dotted lines represent the second order modes. The straight lines represent the nulls of each mode, and as stated before, both the speakers and listener should avoid these locations.
The man in the chair is shown for perspective.

Practical Considerations
So with that being said, where should the speakers and listener be? Before we answer that, there are a few practical considerations we need to think about. First is the door placements, shown in the drawing as the red rectangles. This room still needs to serve as a walkway between the other connected rooms, so the doors cannot be blocked under any circumstances. We also have to remember our indented corner, which means our speakers/listener cannot be placed there either.
In that case, the only practical configuration is to put the speakers around the area shown circled in blue, which means our listening location will be near the center of the room.
The most commonly recommended speaker placement is to create an equilateral triangle between the two speakers and the listener, with each edge of the triangle being 8 feet. However, based on the dimensions and layout, fitting an 8 foot equilateral triangle in this room is practically impossible.
Instead, we can form a more appropriate equilateral triangle with our speakers and listener where each side is 4'8". This will fit comfortably in our room, and still allow for a decent walkway between the three doors.
This 4'8" equilateral triangle is denoted in the figure on the right with the blue dotted lines, where the two speakers are represented by the two red crosses and the listener is represented by the blue circle. This is clearly not drawn to scale, as the dimensions of the room were not drawn perfectly. So although it doesn't appear correct from the drawing, the blue triangle is actually equilateral.


This triangle is placed in the room such that the speakers and listening location avoid the major null lines as much as possible. This results with the right-most speaker being placed 8'8" away from the right wall, and 1'8" away from the back wall.
Average ear height of a person sitting in a chair is about 37 inches, so the speakers are placed 37 inches above the ground (3'1").
Other Considerations
There are some other simple things we can change about the room in order to make it a better sounding room, even before we start with the main acoustic treatment process.
First we can remove the whiteboard on the closest wall, which at the moment is a very reflective surface behind where the listener will be. We can also remove the big panel speakers shown in the picture at the very top of this presentation, which are not ideal for the room and will never be used.
We should also get a new table that is small enough to fit between the two speakers, where a student can place their laptop and other equipment. We should also center the big TV display to be centered with the speakers as well.
Drawing by Nicolas Adler. Not drawn to scale.
First Reflections

The hand-drawing above shows a floor-plan of the room, with the first reflection paths from the proposed speaker positions to the listener. This includes the reflection off the left, right, front, and back walls for both speakers.
First reflections are an extremely important consideration when treating a room, as they can be problematic and interfere with the ideal monitoring conditions. These can easily be addressed by using diffusers, which is explained more later in the proposed treatment section.
This next drawing shows the first reflection paths off the floor and ceiling as well. Since both speakers are the same distance from the listener and the ceiling, the path lengths will be the same for both speakers.
We can then use these path lengths to calculate the theoretical delay time and attenuation from the direct path, which will help determine how significant the effect of each first reflection is.

Calculations
In order to calculate the level difference between the direct path and first reflections, we need to calculate the loss from the distance traveled, and the loss from absorption when reflecting off a surface. Each of these can be determined with the following equations:


where r1 and r2 are the direct path length and reflected path length, respectively. α in this case represents the absorption coefficient of the material that the sound is reflecting off of, which was provided. The total loss can then be found by simply adding the two equations together.
The delay of each first reflection from the direct sound can be found by using the following simple equation:

where the "additional distance" is the direct path length subtracted from the reflection path length. With these equations, we can create a table with each of the first reflections. For simplicity, let's only consider the reflections off of the floor, ceiling, front, and back walls. These calculations will be the same for both the left and right speaker, as they are the same distance from these surfaces.

Funny enough, you can see the additional distance with the reflection off the floor and the front wall are the exact same, which means their delay time will be the same as well. From here, we can plot these reflections on a graph with delay time and level as our dimensions to visualize their effect on the listening experience.
-
Red - floor reflection
-
Blue - ceiling reflection
-
Yellow - front wall reflection
-
Green - back wall reflection
As you can see from the graph, the floor, front wall, and back wall reflections could be considered problematic, as they add a character to the direct sound that should otherwise not be there. These should be considered when proposing an acoustic treatment for the room. The ceiling reflection can be disregarded, as it is inaudible.

Bass Rise
Graph taken from class notes
Bass rise can be casually understood as lower frequencies lingering in the room a bit longer than higher frequencies. A small amount of bass rise in a room is tolerable and could even be considered as desirable, since it is more natural sounding to the human ear. To calculate bass rise in a room, we can use the following equation:

A value between 1.1 and 1.45 is considered permissible. We can use our RT60 measurements at at the different frequencies from Room EQ Wizard to find a bass rise value for our room. These RT60 values used are an average of ten T30 measurements for each frequency.
-
RT60125 = 0.5155 seconds
-
RT60250 = 0.4001 seconds
-
RT60500 = 0.3529 seconds
-
RT601000 = 0.3046 seconds
We can then plug in these values to the equation above to calculate a bass rise value of 1.39. Although this is a bit high, it is still within the permissible range.

Graphed by me, using Matlab.
Full RT60 Plot
Surprisingly, there did not seem to be a way to easily average the different RT60 measurements taken in the Room EQ Wizard software; but fortunately, a classmate Spencer Soule painstakingly averaged the values of all 30 measurements by himself. The figure on the right is the resulting RT60 graph when all the "T30" measurements were averaged. This is extremely helpful, as it gives us an idea as to what areas are problematic.
As you can see, there is an unacceptable peak at 80Hz. This should be taken down as much as possible when proposing an acoustic treatment for the room. Other than that, a reverb time of around 0.3-0.4 seconds is perfect for a room this size.

Graph by Spencer Soule, an MMI606 Classmate.
Room Treatment
With all the analysis, measurements, and calculations complete, we can finally put together a potential acoustic treatment for the room. This process will consist of looking at our untreated room characteristic, and then address specific issues by using bass traps, diffusers, and absorbers.
Bass Traps
Let's start the acoustic treatment proposal by addressing the most blaring issue: the peak at 80Hz. This is most effectively treated by using bass traps, which are placed in the corners of the room to combat room modes (since all room modes terminate in the corners of a rectangular parallelepiped). Since our peak is at 80Hz, we need to find a bass trap that targets that range.
The Wall Bass Trap by Artnovion is the perfect product to address this issue. As seen in the graph below, its peak absorption is at 90Hz, which is close to our target. It also has a gradual rolloff, which will help us reduce our high bass rise. A single bass trap is 3'11", so we can purchase two units per corner, for a total of 8 units. This should effectively combat our issue in the lower frequencies.


From Artnovion website.
Diffusion
Diffusers are effective in spreading reflections around the room, rather than having the path simply "bounce" off a surface in a single direction. This will be especially useful for addressing our first reflections, which we concluded to be problematic earlier.
The drawing shows our first reflection diagram from before, with the addition of diffuser locations notated in blue. By placing diffusers here, the first reflections will no longer travel directly to the listening location, but rather spread around the room. This will result in these reflections being much less audible.
These placements, however, do not account for the floor and ceiling reflections. We will not be treating either of these, as placing diffusers on the floor is extremely impractical, and the ceiling reflections are already inaudible and do not need treatment.

An appropriate product would be the Myron E Diffuser by Artnovion, which will be effective in spreading these reflections. Each diffuser is approximately 1'11", so we can purchase 7 in total to place in the blue regions shown above; 3 for the back wall, 2 for the front wall, and 1 for each side wall. The diffuser on the right-hand side happens to be right where the door is, so the diffuser can be placed on the door itself!
The picture below shows that the diffuser is effective in spreading frequencies between 630Hz and 6300Hz.


From Artnovion website.
Absorption
Another thing we can consider is the use of absorbers. Absorbers are popularly used to lower the RT60 for specific frequency ranges, and normally target anywhere from 500Hz to 2kHz. This range is not an issue as shown in our full RT60 plot, and a reverb time of around 0.3-0.4 seconds is perfect for a room of this size. So, absorbers are not necessarily needed for our acoustic treatment.
However, absorbers can also be very effective in treating first reflections, specifically off the front wall closest to the speakers. Absorbers placed in the appropriate locations can attenuate the first reflections enough so they are no longer considered an issue. These are simply just an alternative solution to diffusers.


The drawing shows our updated diffuser placements, with our new absorber-diffuser hybrids shown in green. We will only need two of these units, which means we will now only need five Myron E Diffusers from before, instead of seven.
Each of these Galan Hybrids are 3'11" x 1'.

The perfect solution would be to use these Galan Hybrid Absorber-Diffusers by Artnovion. As the name suggests, the product combines both an absorber and diffuser into one panel, and has the benefits of each. This will not only absorb a lot of energy from the first reflection, but it will also spread the remaining energy around the room instead of traveling directly to the listening location. We can use these for the first reflection points on the front wall closest to the speakers.
Treatment Effect and Analysis
Now that we have a proposed acoustic treatment, we can determine its effect on the room characteristic by calculating new theoretical RT60 values. We'll start this process by summing the total surface area of each material in the room.
-
5 Myron E Diffusers: 19ft² total
-
2 Galan Hybrid Absorber-Diffusers: 3.8ft² total
-
8 Bass Traps: 61ft² total
-
Doors: 72ft² - 3.8ft² = 68.2ft² total (subtract 3.8 since one diffuser will be placed on a door)
-
TV Display: 17.42ft²
-
Carpet: 239.28ft²
-
Wall Material: 1065.1ft² – 19ft² – 3.8ft² – 61ft² – (72ft² – 3.8ft²) – 17.42ft² – 239.28ft² – 239.28ft² = 417ft²
The subtractions in the "wall material" calculation must happen because the other materials (diffusers, doors, TV Display, etc.) all take away from the total wall material exposed. We are not including the whiteboard or large panel speakers in our calculations, as we are taking them out of the room entirely.
New RT60 Calculation
With the surface area values for each material, we can create a table to calculate the new RT60 characteristic of the room. These calculations traditionally happen at 125Hz, 250Hz, 500Hz, 1kHz, 2kHz, and 4kHz, and are done by finding the total absorption (sabins) at each of these frequencies. Once the total absorption is found, it can be converted to an RT60 value with the following equation:

where V is volume of the room in cubic feet, and A is total absorption in sabins. The absorption coefficient values are primarily taken from this PDF from acoustic.ua. The resulting table is shown below:
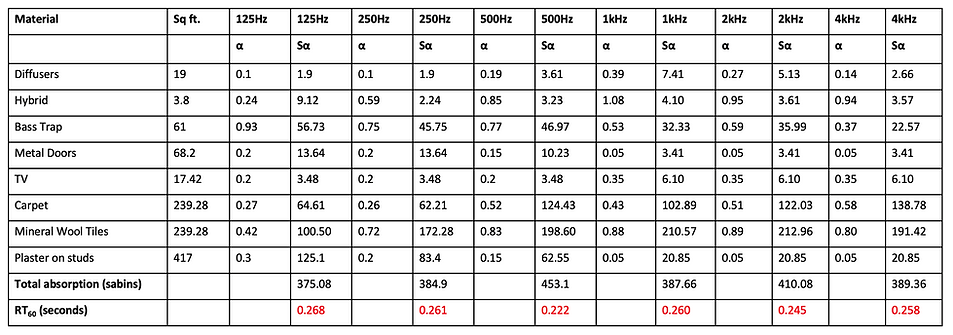
New RT60 Graph and Discussion of Results
We can then plot these new RT60 values to help us better visualize the results and compare to the characteristic of the untreated room. The graph is shown below:
